
Overview
Documenting the modelling of birthright role assignments can take many forms, such as using a spreadsheet or table format in a document, and it typically relies on an individual or team to keep the documentation well maintained, both when updating the model and then after changes have been commissioned into production.
During my consulting and designing of SailPoint Identity Security Cloud (ISC) solutions, handing over the role model of the solution to the customer can be a challenge, in particular how organisations can continue to extend their birthright assignments. Quite often, the documentation becomes easily out-of-date as ad-hoc or unplanned changes are made without going back to update the document-of-record.
In my recent projects, I reflected and re-thought this model of maintaining a ‘document-of-record’. What if ISC was the ‘record’ since that is where it is currently configured, and a document artifact can be created easily and anytime directly from ISC. The challenge is then how to represent criteria-based Roles so that it is clear to understand.
My first step on this mission to document birthright assignments was to:
- Find a way to dynamically create a diagram of each criteria-based role’s membership criteria
- Utilize a scripted approach to retrieve role data from ISC via API
During my research in finding an open source solution to create images programmatically, Graphviz was one of the first I found that seemed to have a good community. While there were others available, I decided to stick with this software for my first version of the solution.
This blog post looks at a PowerShell script I created using the ISC PowerShell SDK and open source graph visualization software Graphviz.
Script Details
The prerequisites to use the script:
- A PAT (Personal Access Token) created in ISC and configured in the PowerShell SDK
- Requires minimum user permissions of Role Admin (ROLE_ADMIN) AND Source Admin (SOURCE_ADMIN) OR Admin (ORG_ADMIN)
- Requires minimum scope permissions of:
idn:role-unchecked:readANDidn:sources:read- OR full permission of
sp:scopes:all
- Managing API Keys and Personal Access Tokens - SailPoint Identity Services
- Authentication | SailPoint Developer Community
- Authorization | SailPoint Developer Community
- SailPoint PowerShell SDK installed
- Graphviz open source graph visualization software installed
Currently this script has been written for Windows.
The high-level flow of the script:
- Declare a function called ‘Parse-Rule’ to generate the Graphviz DOT language for the image.
- Read all ‘enabled’ and ‘criteria’ based roles from ISC.
- Read all sources from ISC and keep the ‘id’ and ‘name’ of each source. This data is needed because only the source id is included in the membership criteria for account attributes.
- Iterate over all roles by calling the ‘Parse-Rule’ function to generate a DOT file for each role, then launch the Graphviz ‘dot.exe’ executable to generate the PNG diagrams to file.
- The PNG files are all stored in the $OutputPath location, named after the name of the role.
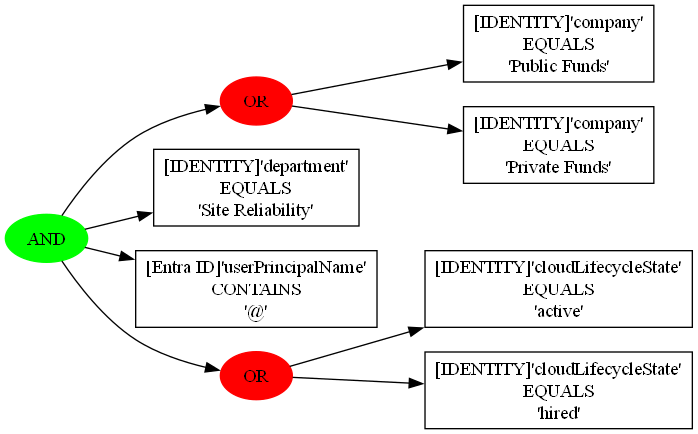
Here is a sample of the generated diagrams:

PowerShell Script
###########################################################################################################################
###########################################################################################################################
##
## This script documents all membership criteria-based roles by generating a diagram of the membership criteria.
## The output files are PNG images.
##
## Pre-requisites to use the script:
## - A Personal Access Token created in ISC and configured in the PowerShell SDK
##   - https://documentation.sailpoint.com/saas/help/common/api_keys.html#generating-a-personal-access-token
##   - select the minimum scope of permissions of
##     - idn:role-unchecked:read
##     - idn:sources:read
##       OR, full permission of ‘sp:scopes:all’
## - SailPoint SDK for PowerShell installed
##   - https://github.com/sailpoint-oss/powershell-sdk
##   - https://www.powershellgallery.com/packages/PSSailpoint
## - Graphviz open source graph visualization software
##   - https://graphviz.org/
##
###########################################################################################################################
###########################################################################################################################

## Variables
$IdentityName = "IDENTITY"
$OutputPath = "C:\Temp\Role Diagrams\"

## Functions
function Parse-Rule {
    param (
        [Parameter(Mandatory = $true)]
        [Object]$Rules,

        [Parameter(Mandatory = $true)]
        [string]$GraphString,

        [string]$ParentNode = $null
    )

    $nodeName = "node" + [System.Guid]::NewGuid().ToString("N")

    if ($Rules.operation -ceq "AND" -or $Rules.operation -ceq "OR") {
        $label = $Rules.operation
        if ($label -ceq "AND") {
            $GraphString += "`"$nodeName`" [label=`"$label`" style=filled color=`"green`"];`n"
        }
        elseif ($label -ceq "OR") {
            $GraphString += "`"$nodeName`" [label=`"$label`" style=filled color=`"red`"];`n"
        }
        else { $GraphString += "`"$nodeName`" [label=`"$label`"];`n" }

        if ($ParentNode) {
            $GraphString += "`"$ParentNode`" -> `"$nodeName`";`n"
        }

        foreach ($rule in $Rules.children) {
            $GraphString = Parse-Rule -Rules $rule -GraphString $GraphString -ParentNode $nodeName
        }
    } else {
        $source = $sources_list | Select-Object | Where-Object { $_.id -eq $Rules.key.sourceId }
        if ($source.name) {
            $sourceName = $source.name
        }
        else {
            $sourceName = $IdentityName
        }

        $label = "`[$sourceName`]`'$($Rules.key.property.Replace('attribute.', ''))`'`n$($Rules.operation)`n`'$($Rules.stringValue)`'"
        $GraphString += "`"$nodeName`" [label=`"$label`" shape=box];`n"

        if ($ParentNode) {
            $GraphString += "`"$ParentNode`" -> `"$nodeName`";`n"
        }
    }

    return $GraphString
}

## Main
# Read all roles from IdentityNow
$Roles = Get-Roles
# Keep all enabled and criteria-based Roles
$Roles = $Roles | Select-Object | Where-Object { $_.enabled -eq $true -and $_.membership.criteria -ne $null }
# Read all sources from IdentityNow and store the id and name
$sources = Get-Sources
$sources_list = $sources | Select-Object id,name

$items = $Roles.Count
$i = 1

ForEach ($Role in $Roles) {
    $percentage = [math]::Round(($i / $items*100), 0)
    Write-Progress -Activity "Processing Roles" -status "$percentage% completed out of $items roles" -percentComplete ($i / $items*100)

    # Prepare content of the 'dot' file to generate the image
    $graphString = "digraph G {`nrankdir=`"LR`"`n"
    $graphString = Parse-Rule -Rules $Role.membership.criteria -GraphString $graphString
    $graphString += "}`n"

    # Save to a .dot file
    $dotFilePath = $OutputPath + $Role.name + ".dot"
    $graphString | Out-File -FilePath $dotFilePath

    # Generate image using Graphviz
    $Arguments = "-Tpng -O `"$dotFilePath`""
    Start-Process -FilePath "C:\Program Files\Graphviz\bin\dot.exe" -ArgumentList $Arguments -NoNewWindow -Wait
    $i++
}
Conclusion
In conclusion, the library of images has been super helpful for me and my customers to visualize the criteria used for each birthright role.
While this is a v1.0 solution to represent the roles clearly in diagrams, I will be extending it over time to automatically generate the documentation artifact around the diagrams directly into a Microsoft Word document. And I’m sure there are a number of other features that can be easily added on top of this solution. I hope you find this useful, and I welcome you to comment on other enhancements you would like to see.