I would like to take a moment to thank @mostafa_helmy & @Bassem_Mohamed for their valuable help, inputs and comments. Kudos to you two! Thanks You!!
Overview
The Access Intelligence Center (AIC) in SailPoint Identity Security Cloud (ISC) serves as an analytics workspace for governing, monitoring and analyzing identity data. It offers persona-based views, advanced analytics, and data exploration tools for better insights and visibility around the identity data. Some of the features include Custom Visualizations, Historical Trend Analysis, Insight Advisor, and Storytelling. AIC includes pre-built dashboards for identity data, access relationship, certifications & access requests, which help in visualizing the organization’s data.
The ER-Diagram for AIC and AIC audit helps understand the identity data and their corresponding data fields. OOTB chart and Dashboard video provide a holistic preview of AIC’s usage.
Note: Access Intelligence Center’s reader permissions allow users to view public sheets and further filter the data. Author permissions extend these capabilities to include creating public or private sheets and bookmarking filters for future reference.
Key Features
- Access Intelligence Center (AIC) offers specialized views for different teams to focus on the data they need.
- A high-level view for identity program owners showing identity relationships, access requests, and certification progress.
- Custom “Sheets” can be built using a drag-and-drop interface with specific measures and dimensions to group and calculate identity data.
- Automatic generation of charts filters for mapped identity attributes like Job Title, Department, or Location.
- Snapshots of specific charts and visualizations can be built into interactive stories for sharing data insights with business stakeholders.
- Charts can be pinned as widgets to the MySailPoint home page for immediate visibility upon login.
Managing Sheets & Viewing Data
Sheets are the core building blocks of the Access Intelligence Center (AIC). They act as dynamic dashboards where you can visualize identity data, such as access patterns, entitlement creep, and audit events.
Note: NERM, DAS and CIEM dashboards require the respective products to be owned.
View Sheets
To view and interact with sheets, follow these steps within the ISC interface:
- Login to Identity Security Cloud (ISC).
- Navigate to Home → Access Intelligence Center.
- Select a dashboard card: Access Intelligence Center.
- Select the Sheet tab.

- Open the Sheets Page: Select Sheets from the menu. This will open the primary repository for all available analytics.

- Choose Your View: On the Sheets page, you can toggle between different visibility levels:
- Public Sheets: These are pre-built or shared dashboards available to everyone with the appropriate permissions.
- My Sheets: This private area contains sheets you have created but not yet published.
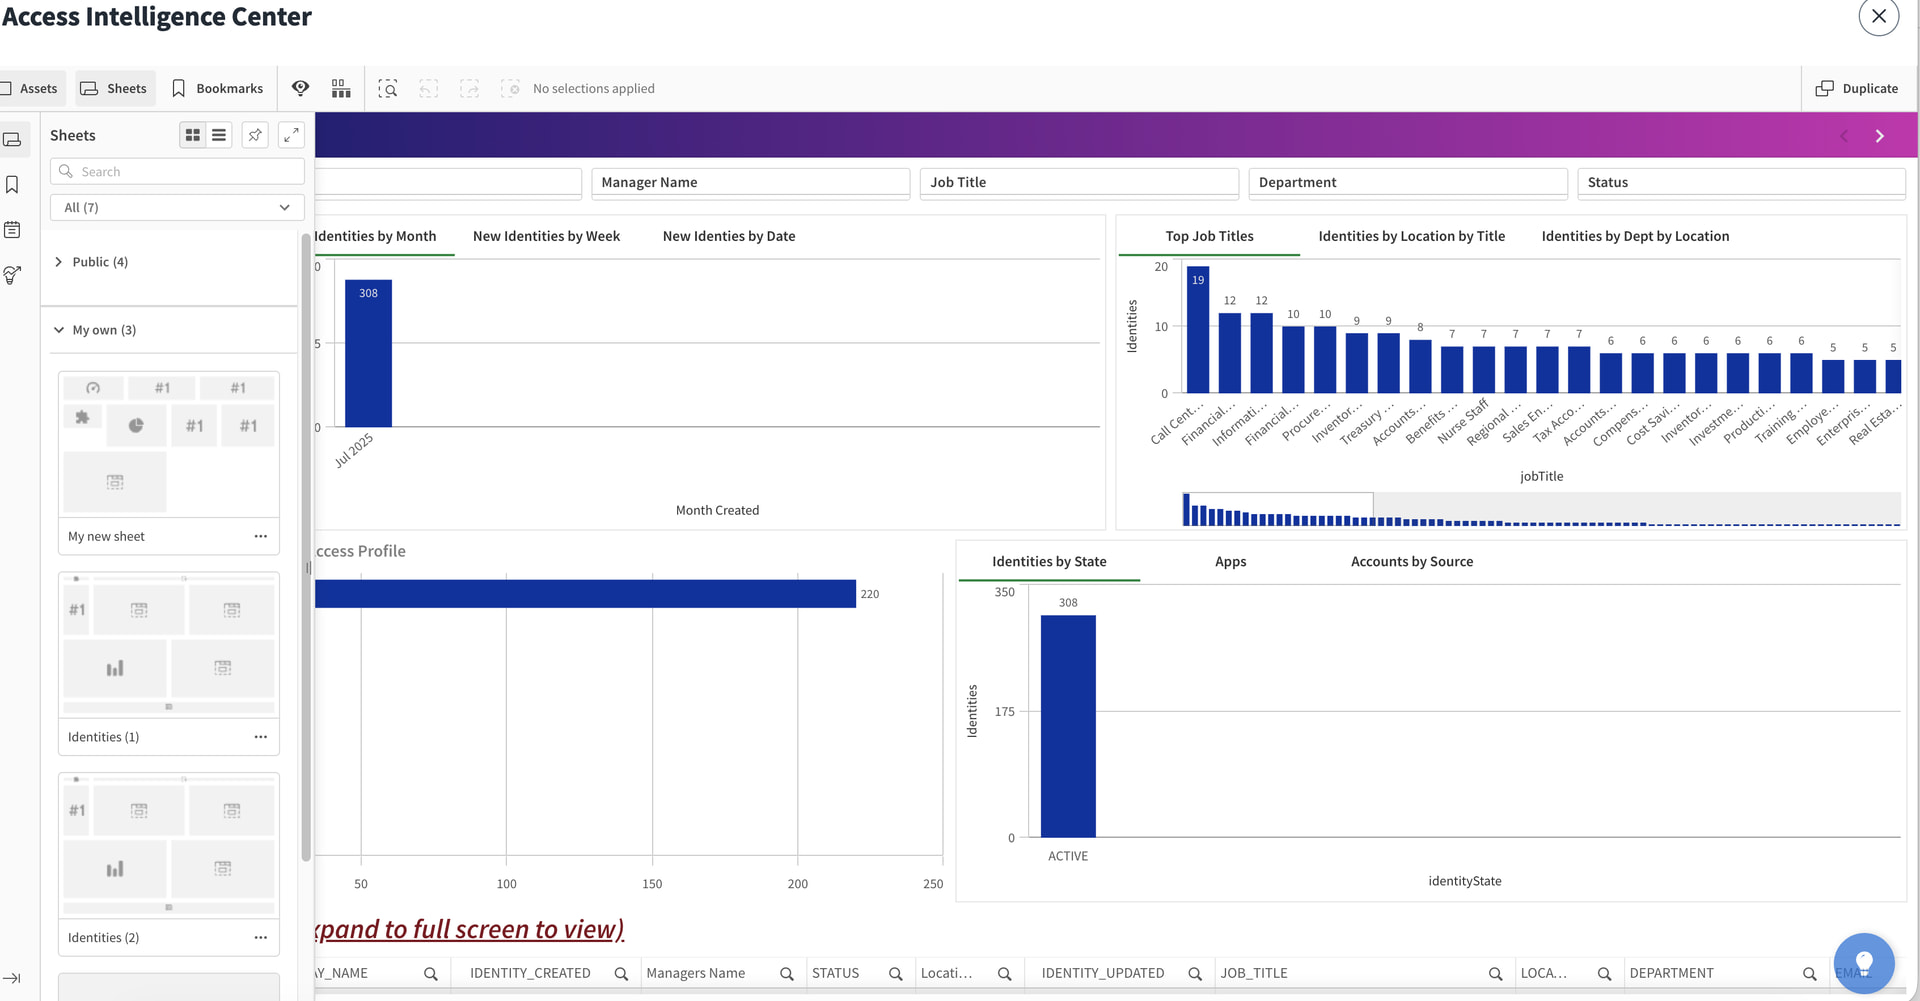
Sheets View
Sheet Management
To manage sheets, AIC has the following capabilities:
- Rename: Select Sheet → Info → Edit Sheet → Update Name → Stop Editing.
- Duplicate: Select Sheet → Right-click → Duplicate (creates private copy).
- Publish: Select Sheet → Right-click private sheet → Publish (makes read-only public; republish updates).
- Unpublish/Delete: Select Sheet → Right-click → Unpublish or Delete (deletes contents irreversibly).
Customize Dashboards & Widgets
In SailPoint Identity Security Cloud (ISC), users have the flexibility to create their own custom dashboards & widgets to display reports based of business requirements.
Creating a New Sheet
- In the Sheets tab, click Create new sheet.

- Select the template of choice, if you wish to customize the whole dashboard you can choose “Empty Sheet”.

- Once Sheet is created, enter “Title” name (e.g., “Identity License Data”) and “Description" (as shown in the below)

- The sheet opens in edit mode with three build options:
- Explore the data : Drag dimensions (e.g., Identity, Application) and measures (e.g., Access Count) to create charts.
- Have a question? (Insight Advisor): Type natural language queries like “Top 10 unused entitlements last 90 days”.
- Create new analytics: Define custom filters, sorts, and limits.

Dashboard Sheet Use Cases
For this example, we are going to create a couple of custom dashboard use case widgets to display an organization’s data.
In the Master Item you can create the data based on “Dimension” & “Measures”.

Total Identities
- To display the total number of identities dashboard widget, use Master item or the below field expression below:
=Count(distinct {$<IDENTITY_CREATED-={'-'} >} IDENTITY_ID)
Inactive Identities
- To display the number of inactive identities dashboard widget, that have “Inactive” Identity State, use the expression below:
=Count(distinct {<identityState -= {'ACTIVE'}>} IDENTITY_ID)

Active Identities
- To display the number of active identities dashboard widget, that have “Active” Identity state, use the expression below:
=Count(distinct {<identityState = {'ACTIVE'}>} IDENTITY_ID)

Lite Identities
- To display the number of “lite” identities dashboard widget, use the expression below:
Lite User-->"=Count(distinct if(Aggr(Count(distinct {<identityState = {'ACTIVE'}>} ACCOUNT_SOURCE_ID), IDENTITY_ID) <= 6, IDENTITY_ID))"

Internal Identities
- To display the number of “internal” identities dashboard widget, use the expression below:
Internal User-->"=Count(distinct if(Aggr(Count(distinct {<identityState = {'ACTIVE'}>} ACCOUNT_SOURCE_ID), IDENTITY_ID) > 6, IDENTITY_ID))"

Accounts per Identity
- To display the number of accounts per identity dashboard widget, we will use both Measure & Dimensions for the data in the category as well as the calculation.
- In the Dimension, use the expression below to show the account respective to its display name:
=ACCOUNT_DISPLAY_NAME
- In the Measure, use the expression below to show the No. of Accounts that an identity holds:
=Count(ACCOUNT_SOURCE_DISPLAY_NAME)

Identities Cloud Lifecycle State & Identity State
- To display all identities cloud lifecycleState and identity state dashboard widget, use the expression below:
Account Display Name-->"=ACCOUNT_DISPLAY_NAME" Cloud Lifecycle state-->"=([cloudLifecycleState])" Identity State-->"=([identityState])"

Identity Breakdown by Department
- Pie chart display showcasing the percentage of identities per department.
- Use Dimensions for Department and Measures for Identities.

Source Types Connected
- To display all source connection types configured dashboard widget, use the expression below:
Source Name-->"=ACCOUNT_SOURCE_DISPLAY_NAME" Connector Type-->"=ACCOUNT_SOURCE_CONNECTOR"

After including all of the above dashboard widgets, the display view would look like the following:
