Debugging
Debug locally
An easy way to debug locally is to use console.log() to print debug information to your console. You can add console.log() statements anywhere, and the messages they print can contain static text or variables. For example, to see the contents of an input object when you are invoking the stdAccountCreate command, you can craft the following debug logic:
export const connector = async () => {
  return createConnector().stdAccountCreate(
    async (
      context: Context,
      input: StdAccountCreateInput,
      res: Response<StdAccountCreateOutput>,
    ) => {
      // Print the contents of input to the console.  Must use
      // JSON.stringify() to print the contents of an object.
      console.log(
        `Input received for account create: ${JSON.stringify(input)}`,
      );
      if (!input.attributes.id) {
        throw new ConnectorError('identity cannot be null');
      }
      const user = await airtable.createAccount(input);
      logger.info(user, 'created user in Airtable');
      res.send(user.toStdAccountCreateOutput());
    },
  );
};
console.log() statements work anywhere, and they work when you deploy your connector to ISC. However, these statements can create clutter in your code. You will often have to clean up debug statements once you are done.
If your IDE supports debugging JavaScript, then your IDE’s built-in debugger can be a powerful and easy way to debug your code.
Debug in VS Code
Debug through the javascript debug terminal
In VS Code, open a javascript debug terminal window and run the npm run dev command.
npm run debug
Now you can set breakpoints in your typescript files in VS Code: 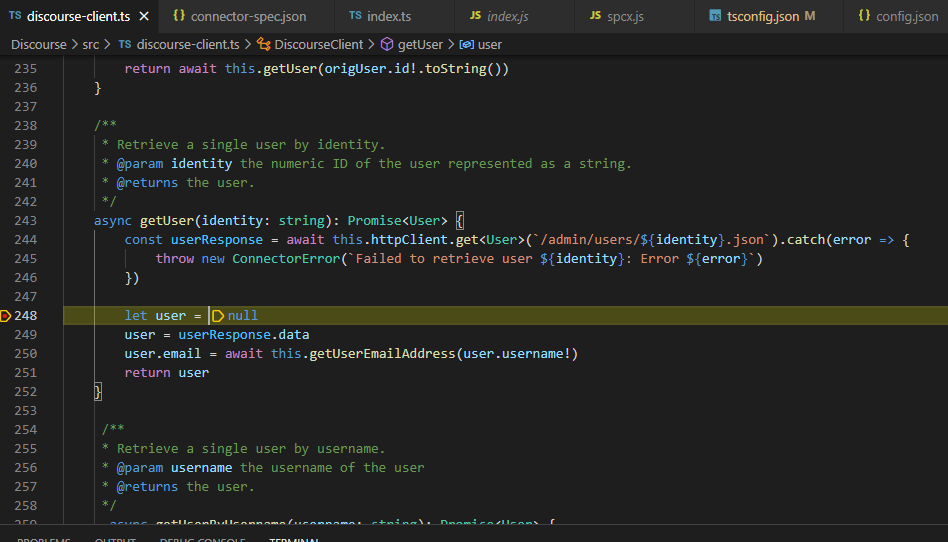
Debug through the VS Code Debug configuration
To simplify the debugging process, you can consolidate the debugging steps into a VS Code launch configuration. The following snippet is an example of how you would do so:
Launch.json:
{
  // Use IntelliSense to learn about possible attributes.
  // Hover to view descriptions of existing attributes.
  // For more information, visit: https://go.microsoft.com/fwlink/?linkid=830387
  "version": "0.2.0",
  "configurations": [
    {
      "name": "Launch Program via NPM",
      "request": "launch",
      "runtimeArgs": ["run-script", "debug"],
      "windows": {
        "runtimeExecutable": "npm.cmd"
      },
      "linux": {
        "runtimeExecutable": "npm"
      },
      "skipFiles": ["<node_internals>/**"],
      "type": "node"
    }
  ]
}
With these configurations set, you can run the debugger by selecting the options shown in the following image:

Debug in Identity Security Cloud
You can use the sail conn logs command to gain insight into how your connector is performing while running in ISC. See the section on logging for more information.